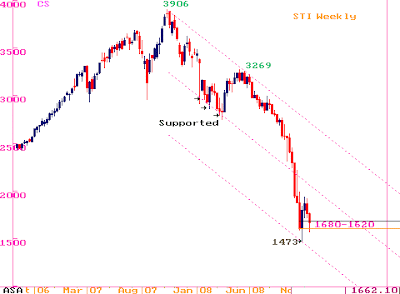
In the review dated 4th Nov(1864) I had anticipated the absolute reversal in the trend, at least till the year end, near 1680-1620 area. Accordingly STI fallen into anticipated area, however, in the last review I had suspected "expanding" triangle(daily chart) & as a precaution argued in favor of continuation of bearish trend, with "buying stop" placed at 1770-1785.
 However, in the last trading sessions, STI has bounced from 0.80% retracement of leg "b", Second, a & b leg had consumed 9 trading sessions, and so far leg c has also taken exactly 9 days. This price as well as time relationship indicates a possibility of end of "c", here, with an up move in sight provided a quick up move above 1785 in the next few days.
 However, in the last trading sessions, STI has bounced from 0.80% retracement of leg "b", Second, a & b leg had consumed 9 trading sessions, and so far leg c has also taken exactly 9 days. This price as well as time relationship indicates a possibility of end of "c", here, with an up move in sight provided a quick up move above 1785 in the next few days.

Traditional SAR (Volatility) system also indicates a reversal in the short term trend provided STI "closes" above 1820 i.e. buying stop for the bulls. {Sar- Stop and reverse system / the dotted line indicates a moving stop for the bears, where the original sell signal came at 3129 level on 9th June}.
 On the weekly charts, after moving in a perfect falling equi-distance parallel channel, since the top, the index got supported exactly on the lower end of the parallel channel on 27th Oct at 1473. Since then it had gained more than 31% before attempting to retest the lows. Quick upmove posting weekly close above 1865 is what required for the bulls to end the 28 weeks loosing streak(since 9th june), with conservative target price near 2k, i.e. value of the middle channel.
 On the monthly charts, STI is continued its struggle near (1780) to its 10 year support (rising trendline drawn since Sep 98 lows). In the last month it has briefly breached the support, but managed to close well above the trendline. For the current month, bulls need to push the index >1780 to remain in the game.
 On the weekly charts, after moving in a perfect falling equi-distance parallel channel, since the top, the index got supported exactly on the lower end of the parallel channel on 27th Oct at 1473. Since then it had gained more than 31% before attempting to retest the lows. Quick upmove posting weekly close above 1865 is what required for the bulls to end the 28 weeks loosing streak(since 9th june), with conservative target price near 2k, i.e. value of the middle channel.
 On the monthly charts, STI is continued its struggle near (1780) to its 10 year support (rising trendline drawn since Sep 98 lows). In the last month it has briefly breached the support, but managed to close well above the trendline. For the current month, bulls need to push the index >1780 to remain in the game.