December 17, 2008

Trading near sensitive area!

China HangSeng(15460) Near Term Trend:Turning Negative!
I said "Watch 14.7k, a break below (on close basis) will lead to shallow down move, may be towards 14.2k -13.5k in the next few trading sessions,On the upside 15.3k is a next hurdle". Since then we had seen index moving in a choppy range of 14.7k to 15.7k; although it has surpassed the important hurdle of 15.3k, I am skeptical about sustainable up move, from here onward. In fact, I am maintaining my original view of "sell" on break of 14.7k, intact. Here is why.The current up move (from 11814) is a "corrective" rally rather than "impulsive" move (lack of faster retracement of previous fall is the main reason). The rise is well supported by the rising trendline (blue), however a downward break can lead to serious setback for the bulls. Value of the trendline for the next 2 days is 15287 & 15469; in short before 14.7k these two values should be treated as protection for the longs, if any.See the inlaid daily -close- chart. In the recent past, the bulls & bears had encountered many furious battles for the control of 14750 (few odd points here & there). Therefore now a move/close below 14750, say 14.7k, will lead to shift in the control of the markets, once again, into bears hand. If one could assume the scenario of breaking 14.7k, immediately, then the H&S reversal pattern will emerge, with a potential of sharp downward correction. Normally, such a small / hidden H&S pattern always cause serious destruction for the bulls. However, if the rally continues , from here onwards, then we could see 17k in the immediate near term. Lets see how the things unfolds.

December 16, 2008

3740 remain untouched...! Weakness persist!

All Ordinaries Index(3499) Near Term Trend: Sideways
I said "The daily/monthly & quarterly charts indicating towards possible "shift" in the control, provided 3400 is defended by the bulls; & on the upside a close above 3740 will be the first sign of the strength". Last week, the index failed to achieve anything, i.e. neither a close above 3740 nor a break below 3400.On the daily charts, I was expecting bullish reversal if the index breaks (upward) the falling parallel channel (blue) and post a close above 3672(on a safer side preferably 3740). Interestingly, the index is indeed trading above the upper end of the parallel channel in the initial part of this week, however will it be able to sustain & close above the channel? It seems doubtful, for the two reasons, first, the break from the important price zones/clusters normally associated with flurry of hectic activities with increase in trading interest (read volume), which is lacking as of now. Second see the following daily chart, the price movements are with the range (of falling channel) & as long as it remains intact, one higher degree (read from weekly parallel channel) break out is always questionable. In short, I will go with sideways option for the near term trading (within the overall bear market) till the things improves a lot (first break from recent channel on the daily charts and then possibly close above 3740).

Failed to clear the hurdle(8700)!

Nikkei 225(8568) Near Term Trend: Sideways
In the previous review I said "Last 4 weeks the index is moving in a tight range of 7.6k to 8.6k, keeping possibility of "double bottom" scenario, alive. It seems that the downside is now fairly protected at 7.6k, but what we need is a quick up move beyond this trading range and then the close above 9.6k for the confirmation of the reversal". However, the bulls failed to take advantage of the situation i.e. absence of fresh bear attack & push the index higher. Further, despite of repetitive attempts (in the last 3 trading sessions) the Nikkei failed to surpass 0.618% fib retracement (of a move from 9521 to 7406) level of 8.7k as evident on the inlaid daily chart.See the inlaid weekly close chart; the Nikkei could never muster the strength to surpass the 8.7k mark on closing basis(even though in intra-week it had rallied to 9.1k-9.3k levels). As such I would persist with an range trading (8.7k-7.6k) view on the Index, within the overall structural bear market, till the bulls shows commitments > 8.7k.

December 10, 2008

STI showing arresting tendency!

Strait Times(1754) Near Term Trend:Turning Positive
In the previous review I said "weakness is persistent on the STI, unless and until seen a move above 1780-1785; the best case scenario is range trading between 1470-1785". Since then we had seen a down move towards 1638 and then a strong rebound almost there near to the upper end of the range.
Now what we required (for trend reversal) is a continuation of the up move above 1754 i,e, yesterday's high, towards the upper end of the range(1780-1785); if failed to hold 1754 then expect shallow down move towards 1650 (max), as the bulls have shown fairly good commitment in the recent past, near 1600 levels. On the monthly close charts, the STI is still holding the long term crucial support (trend) lines indicating a seriousness of the support (as far as long term scenario is concern). Overall, the index is showing arresting tendency on every down move, i.e. reduction in the bearish power, which is a sign of strength for the long term bulls, as well as subsiding the 'fear' of fresh impulsive down move, read 'crash'.

December 9, 2008

Watch 14.7k!

China HangSeng(14753) Near Term Trend:Positive
I said"although the index has seen a positive movement (since 11.8k) as per expectations, the anticipated 'ending' triangle could turned out to be a 'expanding' triangle, thereby keeping the possibility of retesting of Oct lows open; on the upside a weekly close above 14.3k will lead to change in the opinion".
We have seen Index moving upwards (>14.3k) in the initial trading sessions of the current week. The bulls had, indeed, made an strong comeback & avoided unfolding of the expanding triangle scenario. However, in the extreme short term, watch 14.7k, a break below (on close basis) will lead to shallow down move, may be towards 14.2k -13.5k in the next few trading sessions, a good buying opportunity for the medium term. On the upside 15.3k is a next hurdle (on close basis).See the inlaid weekly close chart, the index had formed classic double bottom reversal pattern near 12.6k mark (12618 for the week ending 24th Oct and 12659 for the week ending 21st Nov- tolerance of less than 0.5%). If able to protect this double bottom, the index can lead to significant recovery as far as medium to long term trend is concerned. Remember that 12.6k is slightly below the quarterly threshold level (explained elsewhere) and the bulls need a strong comeback above 13.9k by the quarter end i.e. Dec 2008. In that sense the positioning of this 'reversal' pattern is such that it can provide a much required 'firepower' for the bulls to sustain/stay above 13.9k by the year end. Will it be able to do that? I think so...lets see who the index evolves in the next few weeks.

Final combat...(3400-3740)..?

All Ordinaries Index(3533) Near Term Trend: Turning Positive
I said "the activity now shifted to new falling parallel channel (blue), unless seen the close above this channel (last weeks value 3740) the downtrend will remain intact; on the quarterly charts 3400 is crucial, holding close above this in the current quarter (Dec 08) will be a positive development".
Last week the index failed to archive the feet, now once again making attempt to break the upper end of the channel (blue-3672) in the current week. Once seen close above 3672, on the safer side I will go far value of 3740, the reversal will be in sight. However on the downside, the strong support is emerging near 3400 mark, the key reversal point observed on monthly/quarterly chart. As long bulls defends this area, the possibility of reversal, at least short to medium term, will remain alive. See the inlaid monthly chart. Despite of the last months dip slightly below 3.4k, we have a sharp rebound in the fag end of the month, thereby restricting the months close well above the threshold. The strength, seen here in the bulls camp, is likely to be put for the severe test in the next few trading sessions before making a final attempt to surpass 3740. In short, I am expecting a fierce battle in the ranges (3400-3740) and break out thereafter, mostly upward.
On the quarterly chart the index is showing repetitive rebounds near the very curial trendline support of 3400. The end of this months trading will clear the 'fog' i.e. whether it holds the key level of 3400. Overall, the daily/monthly & quarterly charts indicating towards possible "shift" in the control, provided 3400 is defended by the bulls; on the upside a close above 3740 will be the first sign of the strength.

Holding double bottom, good times ahead...?

Nikkei 225 (8395) Near term trend: Positive I said "the index is making confused moves, I will turn bullish only if closed > 9k; on the downside if broken 7960, it may retest October low".
As anticipated the Nikkei slipped below 7960, but restricted the fall to 7406, rather than retesting Oct low of 6994. For the last 4 weeks the index is moving in a tight range of 7.6k to 8.6k, keeping possibility of "double bottom" scenario, alive. It seems that the downside is now fairly protected at 7.6k, but what we need is a quick up move beyond this trading range and then the close above 9.6k for the confirmation of "reversal" and corrective rally in the next few weeks/months towards 10.5k-10.8k mark.

Bulls are ready for the counter attack..?

World Index(311) (In house-based on 44 active indices of the world) Near Term Trend: Positive
In the last review (293) I said "a move beyond upper end of the channel (daily) will confirm end of wave 'c', thereby opening wave 'd' on the upside;on the weekly charts a move beyond 329 is required for confirmation of reversal of the trend; on the monthly charts there is a 'possibility' of double bottom provided we should not see a down move, below the October lows, from here". This we have seen happening (anticipated recovery) in the last 2 weeks. See the inlaid daily chart; the wave 'c' ended exactly there(at the last review date) & as anticipated the index broken the falling parallel channel, thereby resuming wave 'd'. Now, expect continuation in wave 'd' & then swift down move (last) "e", may be by year end.On the weekly chart (first two trading sessions of this week) the bulls swung back and attempting an upward break of the falling parallel channel (blue), i.e. indicating an reversal in the trend. Still on a safer side, we will wait till break of '329' for a confirmation. In short, as anticipated, the "world markets" are holding October cycle lows and the bulls are making 'careful' attempts to regain the control, once again, at least for the next few weeks/months. On the downside, the possibility of fresh 'slide' is low, however, retesting of October low on some of the world indices can't be ruled out, but this slide will be an opportunity to 'buy' rather than 'sell'.

December 4, 2008

Bulls gathered (much) required strength...

China SSE Composite(2001) Near Term Trend: Positive
In the last review I said "Near term trend is positive;expect a swift up move towards next crucial level of 2.2k; stop is placed at 1740-1780". Since then the index consolidated within the range of 1850-2000, without disturbing the bullish setup. See the inlaid daily chart, the index has retraced the previous down move (from 2050 to 1838) of 9 days in just "three" trading sessions (today's high is 2055). This faster retracement of the previous leg indicates a much required "strength" in the bulls camp, to head higher. On the monthly chart , as anticipated, the index has given upward break to the falling parallel channel, drawn from recent all time high(Oct07). This is an indication of change. Therefore for now, we see some support coming for the medium term. Move stop to 1840- on close basis-(from existing 1740). On the upside, as advised earlier, we maintain our near term target at 2.2/2.3k.

December 2, 2008

Weekness persist!

Strait Times(1655) Near Term Trend: Negative
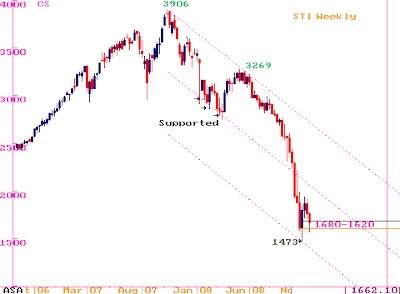
In the last review I had argued that "STI is trading close to "reversal" points, however, a quick up move above 1785 is required to end the minor trend near 1565 with opening of short to medium term uptrend; Volatility SAR indicator pointing a reversal in the trend if able to close > 1820; on the monthly charts bulls need to 'push' the index above 1780 for the current month to remain in the game". The STI made an attempt to recover, but the trading remained confined below the crucial levels of 1780-1785, indicating lack of strength. See the inlaid weekly chart, failure to sustain above 1780-1785 can lead to retesting (breaking?) the recent low of 1473 and then lower end of the equi-distance parallel channel(1360). On the monthly chart, the month of November ended below the threshold. Now its trading below the long term trendline drawn from 1998, indicating continuation of the down trend. How much it can go down from the current levels? Its very difficult to answer that question. The best case scenario will be 'lackluster' range trading in 1470-1785 area.

Required close above 3740; else...

All Ordinaries Index(3484) Near Term Trend: Negative
In the last review(3483) I had stated "the trend is down; expect short term respite if able to hold 3400(then value of the lower end of the parallel channel); on the monthly charts, again, 3400 is a critical long term support; however if failed to hold & recover we may test 3000". Since then it broke the lower end of the channel (dotted) & went below 3.4k, only to recover and zigzagged between 3.2k-3.6k. In the process the dotted channel has lost its importance and now the focus is shifted to the "blue channel". Last week & the beginning of the current week we saw a hectic activity near the upper end (3740 value for this week) of this new blue channel. Unless seen a break & "close" above 3740 the downtrend will continue, unabated. The value of the lower end of the parallel channel is between 3k to 2.8k for the next 1-2 weeks.
On the long term charts (Quarterly), the Index is retesting the trendline drawn from low of Mar 1991. The value of the trendline, for the current quarter, is 3360, say 3.4k.Will it able to hold it? Lets wait and watch, rather than pre-empt.

November 23, 2008

Short term bounce, before moving to $40-$37...?

Crude Oil West Texas Intermediate($49.62) Oil has dropped over 67% in just 4 months. See the inlaid daily chart; the fall was confined to perfect falling parallel channel drawn from the top.
The recent low is quite close on the lower end of the channel, indicates a respite for the Oil bulls in the near future, provided holds $47.5/$48 area. On the upside $53 is critical & if able to sustain above it then could flare up to $60-$63 in the next few weeks. However, the medium to long term picture continued to remains bearish. See the inlaid monthly chart. Since 1990, $37-$40 has acted as a good resistance while moving up; now the same will act as a "support" for the medium term. To conclude, I am looking for a relief rally if holds $47.5/$48 mark; while the upside is caped at $60-$63 range; & then a likely failure towards the long term support zone. Let see.

Trading close to reversal points!

Strait Times(1662) Near term trend: Negative/Pending reversal
In the review dated 4th Nov(1864) I had anticipated the absolute reversal in the trend, at least till the year end, near 1680-1620 area. Accordingly STI fallen into anticipated area, however, in the last review I had suspected "expanding" triangle(daily chart) & as a precaution argued in favor of continuation of bearish trend, with "buying stop" placed at 1770-1785. However, in the last trading sessions, STI has bounced from 0.80% retracement of leg "b", Second, a & b leg had consumed 9 trading sessions, and so far leg c has also taken exactly 9 days. This price as well as time relationship indicates a possibility of end of "c", here, with an up move in sight provided a quick up move above 1785 in the next few days.
Traditional SAR (Volatility) system also indicates a reversal in the short term trend provided STI "closes" above 1820 i.e. buying stop for the bulls. {Sar- Stop and reverse system / the dotted line indicates a moving stop for the bears, where the original sell signal came at 3129 level on 9th June}. On the weekly charts, after moving in a perfect falling equi-distance parallel channel, since the top, the index got supported exactly on the lower end of the parallel channel on 27th Oct at 1473. Since then it had gained more than 31% before attempting to retest the lows. Quick upmove posting weekly close above 1865 is what required for the bulls to end the 28 weeks loosing streak(since 9th june), with conservative target price near 2k, i.e. value of the middle channel. On the monthly charts, STI is continued its struggle near (1780) to its 10 year support (rising trendline drawn since Sep 98 lows). In the last month it has briefly breached the support, but managed to close well above the trendline. For the current month, bulls need to push the index >1780 to remain in the game.

November 22, 2008

Holding "October" low..Reversal is in sight..

World Index(294) (In house-based on 44 active indices of the world)
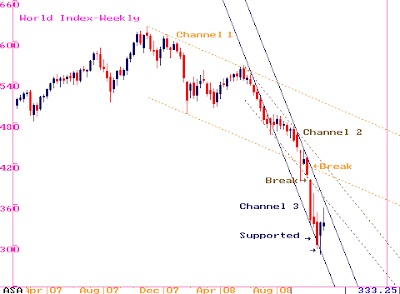
Last 3-4 weeks, I am arguing for a "recovery" in the global stock markets, based on 'macro' level technical analysis of this 'in house' World Index (WI). This week, I maintaining my pending bullish reversal stance, despite of a 15% drop since the beginning of the month. The current month, so far, has not created a fresh low visa-a-vis the month of October (see inlaid monthly chart). As such there is a possibility of "double bottom" formation, here, provided we should not see a fresh "down move" from the present level. Further the index is almost there at previous consolidation zone (Jan-May 2005), normally such crucial zones created in the up move acts as "support" zones in subsequent down moves. On the weekly chart, the price moves are still intact in the falling parallel channel (3rd) & a move beyond 329 (value for the coming week) i.e. break above the upper end of the channel is required for the first stage confirmation of reversal in the trend.
On the daily charts, I am suspecting a "triangle'"(14 Oct is a starting point) with "a" wave ending at 286 (27th Oct); wave "b" retracing 80% of wave "a"; & the current fall could be wave "c". The wave 'c' has unfolded exactly within the falling parallel channel, and a move beyond the upper end of the channel can confirm the end of the wave "c", thereby opening wave "d" on the upside. Even if we assume the end of the wave "c" is still away, notice that the last 2 trading sessions are very close to the lower end of the parallel channel, which in anyways suggests an up move at least till the upper end of the channel. In short, the WI is at very crucial point, as far as all the 3 time frames(Monthly/weekly/Daily) are concerned; holding the Oct low (i.e. 27th Oct) would lead to 'significant' up move in the next few weeks/months. Let see how the things unfolds.

Global Markets & performance of BRIC

World Index Vs BRIC
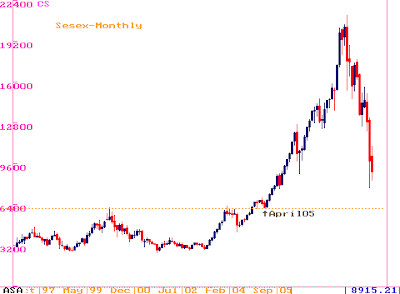
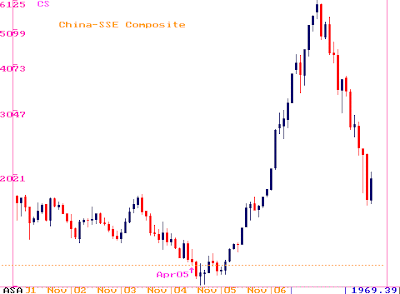
In the World Index (WI) analysis we have seen that WI has retraced back to the April 2005 level. The "Developed" economies had significantly lost the value in the current financial turmoil, with many indices retraced as much as to 2003 levels(DOW,Nikkei,FTSE,CAC40) with only one participation form emerging economies, Taiwan. However from the BRIC group, Brazil, India & China has manged to stay afloat above April 2005 lows, with Russia going down slightly below April 2005. (See respective charts). Few others economies like Chile (SASE), Indonesia(JSX), Mexico (MXSE),PERU(LIMA),S.Africa (JSE All), S.Korea(KOSPI),Venezuela (IBC) are trading at higher levels than there respective April 2005 lows. Brazil IBovespa
Russia MOS Times India-Sensex China-SSE Composite

November 20, 2008

KLSE -downward bias

KLSE Composite(877) Near term trend:Negative Similar to many Asian markets, KLSE is also showing "expanding" bias on the down move, which could lead to more down side may be retesting of its previous low. Stop 900.

AORD broken stop..watch 3400! Else..

All Ordinaries Index(3483) Near term trend:Negative
In the last review I had argued in favor of corrective rally by year end; also mentioned 3.9k as near term stop for the bulls. The index failed to move upward as anticipated & also broken the stop in quick time. In fact AORD was the only major index to break below the recent October low, indicating continuations of the downtrend contrary to our views.
Observe the inlaid weekly chart. The prices are near to its lower end(3400) of the parallel channel (dotted), suggesting possible respite in the extremely near future. However if broken downward then the index is likely to fall into steeper falling parallel channel (marked in blue) where the lowest value of the lower end trend line is near 3k.
On the monthly chart, the index is near to its critical long term support line, the value is also near 3400; below that 3k.

November 19, 2008

HangSeng ..suspected expanding triangle..

China-HangSeng(12815) Near term trend:Negative I said "I am expecting a pause in the uptrend with suspecting" ending" triangle formation where "b" leg is likely to be ended near 14.6/14.7k and "c" leg will open downward with target price of 12300-11650; which can provide excellent opportunity to buy for a medium term rise".
HangSeng moved down exactly as per expectation. However an anticipated "ending" triangle is likely to be turned out as "expanding" triangle which may lead to a serious downfall , may be retesting of previous lows. On the upside, a weekly close above 14.3k will compel us to abandon the 'bearish' view on the index.

Bullish only if trades > 9k!

Nikkei 225(8273) Near term trend:Negative
I said "Nikkei has fair chance to comeback with corrective rally, at lasting till the year end, based on observations on weekly/daily charts ; on the upside close above 9601 is important". However the last few trading sessions the Index has shown "confused" trading signals and is barely able to float above the 0.50%-0.618% fib retracement levels (8260-7961) mentioned as supports in the previous updates. I withdrew the "corrective" rally call, and will turn bullish only if it able post weekly close above 9k. On the downside once 7960 is taken, the index may retest the recent lows.

Expanding Triangle .? Heading towards new low.?

Straits Times(1665) Near term trend: Negative
In the last review I said "Considering the observations on weekly/monthly charts the possibility of significant bottom formation at recent low of 1475 is bright; However in the near term the existing rally is likely to be terminated anywhere between 1900-2000 with possibility of retesting 1680-1620".
As expected, the STI topped out at 1933 & fallen within the anticipated range. But the major difference is that, earlier I was expecting a confirmation for major reversal in 1680-1620 range. However looking at the daily price structure, expanding triangle formation (with "b" leg of the triangle has retraced 0.618% of "a" leg; the current fall could be "c" leg, which may retest the recent low) the possibility of bullish implication is ruled out, at least till seen close above 1770-1785.
On the weekly charts, value of the lower end of the parallel channel stands around 1400-1370 for the next 1-3 weeks. Will it test? If the "expanding" triangle scenario unfolds then "Yes". Lets see.

Failed to suprass 4325! New low?

FTSE 100(3999) Near term trend: Negative
In the last review, I have argued in favor of 'corrective rally' saying that " the recent fall from 4.6k is a part of overall "recovery" attempts rather than fresh fall; On the upside close above 4375 is required to add strength in the recovery attempt; whereas stop is placed near 0.618% fib level".
However, today's break of 0.618% retracement level is "significant" development and has jeopardize the interest of bulls, completely. On the weekly charts, the lower end of the parallel channel is the next price level to watch i.e. 3.6k. Whereas on the daily charts, the expanding shape will continue to have negative implication for the index, as long as it remains below 4.3k. In short the "trend" is still down in absence of 1) Trading above crucial level of 4325 2) Break of 0.618% Fib level. On the downside I am open for 'anything' in the medium term & 3.6k in the extreme short term, provided we remain below 4.3k.

November 14, 2008

Corrective rally is on...

FTSE 100(4169) Near term trend: Positive
After creating "double top" bearish formation at 6150 in Oct 07, FTSE tanked more than 45% in "global equity meltdown". Two weeks back the index recovered "exactly" from the lower end of the "equi-distance" parallel channel, thereby providing excellent opportunity for the bulls to fight back.
Since then i.e. from low of 3665(27th Oct), FTSE has gained over 26% with a high of 4639, before correcting downward. However this down move is likely to be a part of overall "recover" atttempts rather than fresh "fall". This bullish argument is also "in line" with overall bullish view discribed under "World index" analysis. On the daily chart, FTSE has formed suspected "expanding" triangle formation and the last leg is likely to end anytime, may be near 4k. On the upside "close" above 4375 will add much require strength in the medium term uptrend, eying 4.6-4.8k in the next few weeks, or may be by year end. Stop 4k.

Dragaon retaliating....indeed. Now 2.2k is crucial!

China-SSE Composite(1927) Near term trend: Positive
I argued in favor of pending "bullish reversal" in Shanghai Index, in the last review dt 23 Oct, with anticipating strong support near 1740-1780, based on observations noted on "monthly" chart. The index consolidated almost exactly there (tolerance of 2-3%) in the support zone, before retaliating. Remember that the so-called 'fundamental' good new flown into the market much later, but prices have already made a 'base' near the historic support zone. Now, expect continuation of the swift up move, with 'stop' placed at 1740-1780. On the upside the upper end of the parallel channel is the 'trend' deciding factor, for the current month the value of the highest point is around 2157(say 2.2k); good if it breaks, in this month itself, else "trading" range between 2.1k-1.7k till the year end.

November 10, 2008

Seen anticipated recovery efforts....

World Index(333) (In house- based on 44 active indices of the world) Near term trend: Positive
In the last review (21st Oct) I had argued in favor of "Bullish reversal" at least in the short to medium term, in the World index, based on a)Possible halt in the furious fall at fib 0.618 retracement of entire bull run (2003-2007) b) Importance of October time cycle in economic cycles. See the inlaid monthly "close" chart, the month of "October" has ended almost exactly on 0.618 fib level, thereby making an attempt to halt the unprecedented fall in the global markets, at least in near term.
Further, I had also illustrated 3 downward parallel channels on the weekly chart in the previous review. As anticipated the lower end of the 3rd channel (Blue) has successfully supported the fall, causing recovery across the global markets.
Now expect a continuation in the "recovery efforts" , in the next 4-7 weeks, or may be till the year end, provided the index "pierce" the "important" hindrance of the "upper end' of the 3rd (blue) parallel channel.

AORD at long term support....!

All Ordinaries Index (4006) Near term trend: Positive (stop 3.9k)
AORD lost 46% since its all time high(6873 Nov 07) i.e. worst than 1987 fall. However, along with anticipated global stock market recovery (see world index analysis), we are heading for a corrective rally based on following "Technical" observations. See the inlaid "Quarterly" chart. The index has been supported "exactly" on the trendline drawn from 1991 low of 1275.
Considering the magnitude of the fall (46% in just 12 months), & the earlier excellent supports (Dec92, Mar03) provided by this long standing trendline of 17 years, expectations of the "rally" are justified. But is it complete "reversal" of the trend? Lets see how the trend evolves in the next few weeks/months.
On the extreme near term (daily) charts, the recent fall (from 4291) has given fib 0.618% retracement of the entire rally (3693-4291), now expect 3921 as a good support for the bulls in the near term (near Stop). On the upside, once taken 4.3k expect a steady build up towards 4.4-4.5k in the next few weeks, or by the year end.